Model Serving Performance Test - A Deep Dive
Challenges of Model Deployment
In real production environments, people care greatly about the online service performance of models (e.g., latency, throughput) and the degree of hardware utilization (e.g., compute utilization rate, memory usage), as well as the friendliness to business logic developers (e.g., system API design).
Therefore, optimizing inference before model deployment has recently become a hot research area. This mainly includes pruning, quantization, and various compilation optimizations, which are optimizations applied to the model itself.
After optimizing the model, it is still necessary to select the appropriate deployment tool (serving platform) for different business scenarios. The main pre-trained models currently include:
- TensorFlow (Keras)
- PyTorch (TorchScript)
- ONNX
- Caffe
- …
These different models can be deployed on different serving platforms, with the main serving platforms being:
- TensorFlow Serving
- ONNX Runtime
- Triton Inference Server
- *Flask (or FastAPI) + inference functions
- …
In academia, the last method is often used to showcase model demos. However, the performance of simple custom servers is challenging to guarantee, and they are less frequently used in real production environments. The main reason is that a custom backend needs to manage hardware resources like GPU/CPU. When using tools like Flask or FastAPI, hardware resource management is handled by the backend framework, making it challenging to optimize for accelerated hardware.
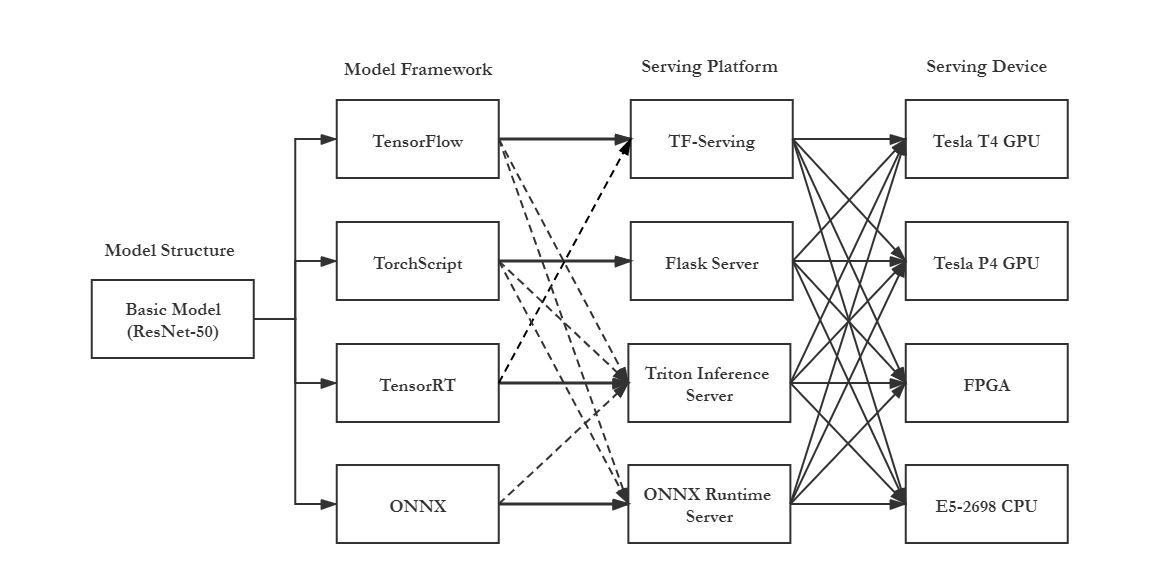
A simple model deployment can be represented by the following diagram, with the dashed lines indicating models that can also be deployed. As we can see, given the variety of model training frameworks, model types, deployment frameworks, and hardware, a model can be deployed in many different ways.

This is just the tip of the iceberg. After selecting a model deployment framework, additional challenges naturally arise in increasingly complex business scenarios, such as resource scheduling and task distribution in large-scale service clusters. Many related papers have appeared at major systems conferences this year.
In summary, from the moment a model is trained to when it becomes a real application serving millions of users online, there are many pitfalls and hidden steps. Researchers and engineers need to bridge these gaps together. Pursuing higher efficiency, stability, and flexibility for different business extensions has become a new challenge for traditional system researchers in the new machine learning inference systems.
Improved Performance Testing
With this background, model performance is not solely determined by accuracy, memory footprint, and FLOPs. At the level of a serving system, different business scenarios need to be considered. A comprehensive benchmarking tool is essential for the entire inference field. The ultimate goal of a good benchmark tool is to help users understand the performance of online services comprehensively. Benchmarks can be divided into dynamic and static analyses. Static analysis refers to performance references obtained through look-up tables and theoretical calculations of the model or hardware; dynamic analysis refers to simulating a real production environment by using a certain number of requests and sending patterns to obtain dynamic performance reports.
For model complexity:
- FLOPs (time)
- Memory footprint (space)
For the mounted hardware:
- FLOPS (theoretical compute capability)
- Memory
- Bandwidth
Dynamic analysis is relatively complex, and the metrics are correspondingly more varied. Different business scenarios may require different metrics. Commonly used metrics include:
For model deployment framework (software):
- Latency (P50, P95, P99) (ms)
- Throughput (varying batch sizes) (req/sec)
For model acceleration hardware:
- Average hardware utilization (%)
- Average memory utilization (%)
- Energy consumption per inference (J)
- Carbon emissions per inference (mg)
- Cold start time (sec)
- System startup time (sec)
For the model service pipeline:
- Pre-processing latency (ms)
- Post-processing latency (ms)
- Transmission time (ms)
Existing excellent works, including MLPerf, AIBench, etc., are very good but have corresponding limitations. For example, MLPerf does not include pipeline analysis and does not provide a standardized benchmark tool. After all, in a real production environment, speeding up model inference may not bring significant improvement to specific business logic because the performance bottleneck may be in data processing or transmission time.
Similarly, for mobile devices (edge devices), inference systems pay more attention to model storage occupancy and battery consumption, so energy consumption and hardware utilization during inference should be the focus. Different systems require different analyses.
For a good benchmarking system, test requests should be as close to the real production environment as possible. The simulated workload should include extreme sizes (burst rate) and block-style baseline request sending. Generally, it can be summarized as the following scenarios:
- High workload in a short time, testing the system’s robustness
- High workload over a continuous period, examining the system’s tail latency
- Blocking-style (possibly with multiple concurrencies) fixed-quantity requests, observing hardware utilization and model performance
- Long-term system testing based on workload generated from traces (e.g., Poisson distribution generation)

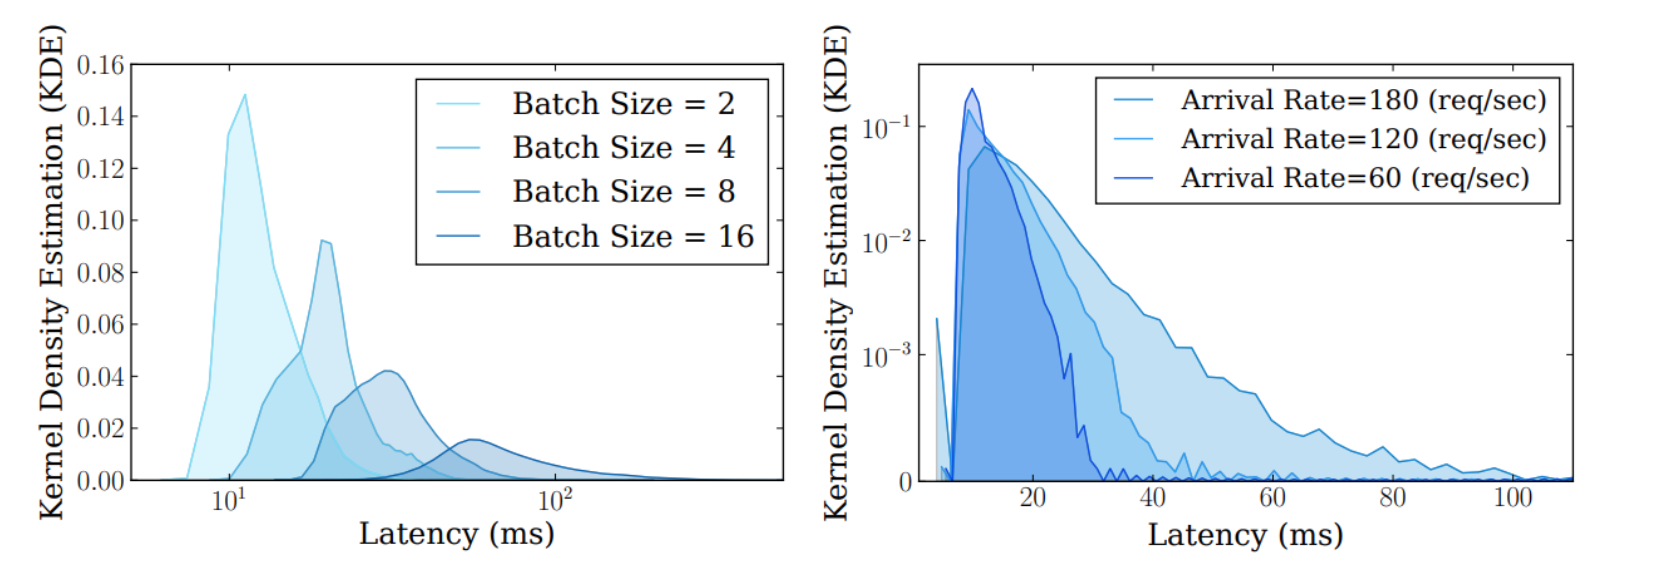
Since inference often occurs online, in many scenarios, batch prediction is not feasible. No matter how many concurrent requests there are, hardware resources may not be fully utilized. Currently, TensorFlow Serving and Nvidia Triton Inference Server support dynamic batching, and it is believed that more inference frameworks will support it in the future. Benchmark tools should cover testing methods for requests with varying batch sizes (based on personal experience, tuning dynamic batching parameters incorrectly can decrease system throughput. As shown below, the left diagram is Nvidia Triton Inference Server, and the right is a PyTorch Dynamic Batching implementation on Flask. If the total number of requests received within the maximum waiting time for the request queue does not meet the target batch, the benefits of batch predict may not offset the waiting time’s overhead, resulting in an actual performance drop).

(the left-side is TensorFlow Serving, the right-side is Dynamic Batching on Nvidia Triton Inference Server)
More Comprehensive Analysis Methods
After scientifically and uniformly testing performance, how to analyze it is also an important step in improving existing inference systems. Common analysis methods include data visualization and horizontal and vertical comparisons of data across different dimensions. This section won’t go into details, as the primary purpose of benchmarking tools is to obtain more scientific performance data.
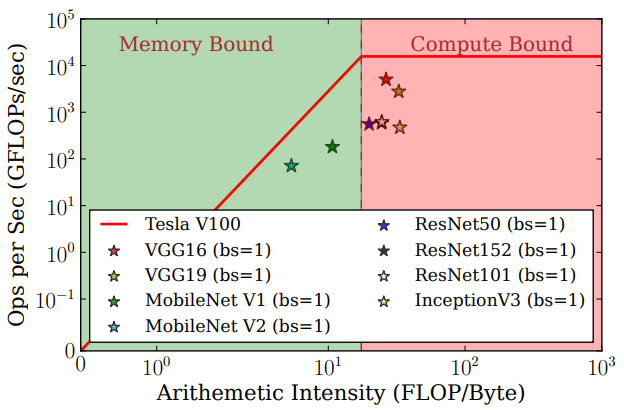
Here’s an example of an analysis: performing a Roofline Model analysis by combining dynamic data obtained from benchmarking with calculated theoretical values. Below is a Roofline Model of some common models:

The red ceiling line represents the theoretical bandwidth and compute capability of Tesla V100. The model’s compute intensity (horizontal axis) is calculated from the model’s theoretical FLOPs and memory footprint. The vertical axis of the model is obtained from the benchmark system by calculating the model throughput (peak QPS at batch size 1). All models (TF-SavedModel) are deployed through TensorFlow Serving.
The left area of the graph indicates models limited by hardware bandwidth, while the red area on the right indicates models limited by hardware computing capability. It’s easy to see that MobileNet, which has low compute intensity, is primarily affected by hardware bandwidth, while VGG, with high compute intensity, is mainly constrained by hardware compute capability.
The fact that none of the points reach the theoretical ceiling is because the throughput measured here includes simple data processing, I/O, and transmission time. These are often overlooked but are crucial parts of the serving pipeline improvement. In actual inference processes, various other factors may affect the system’s ability to reach the theoretical optimum.
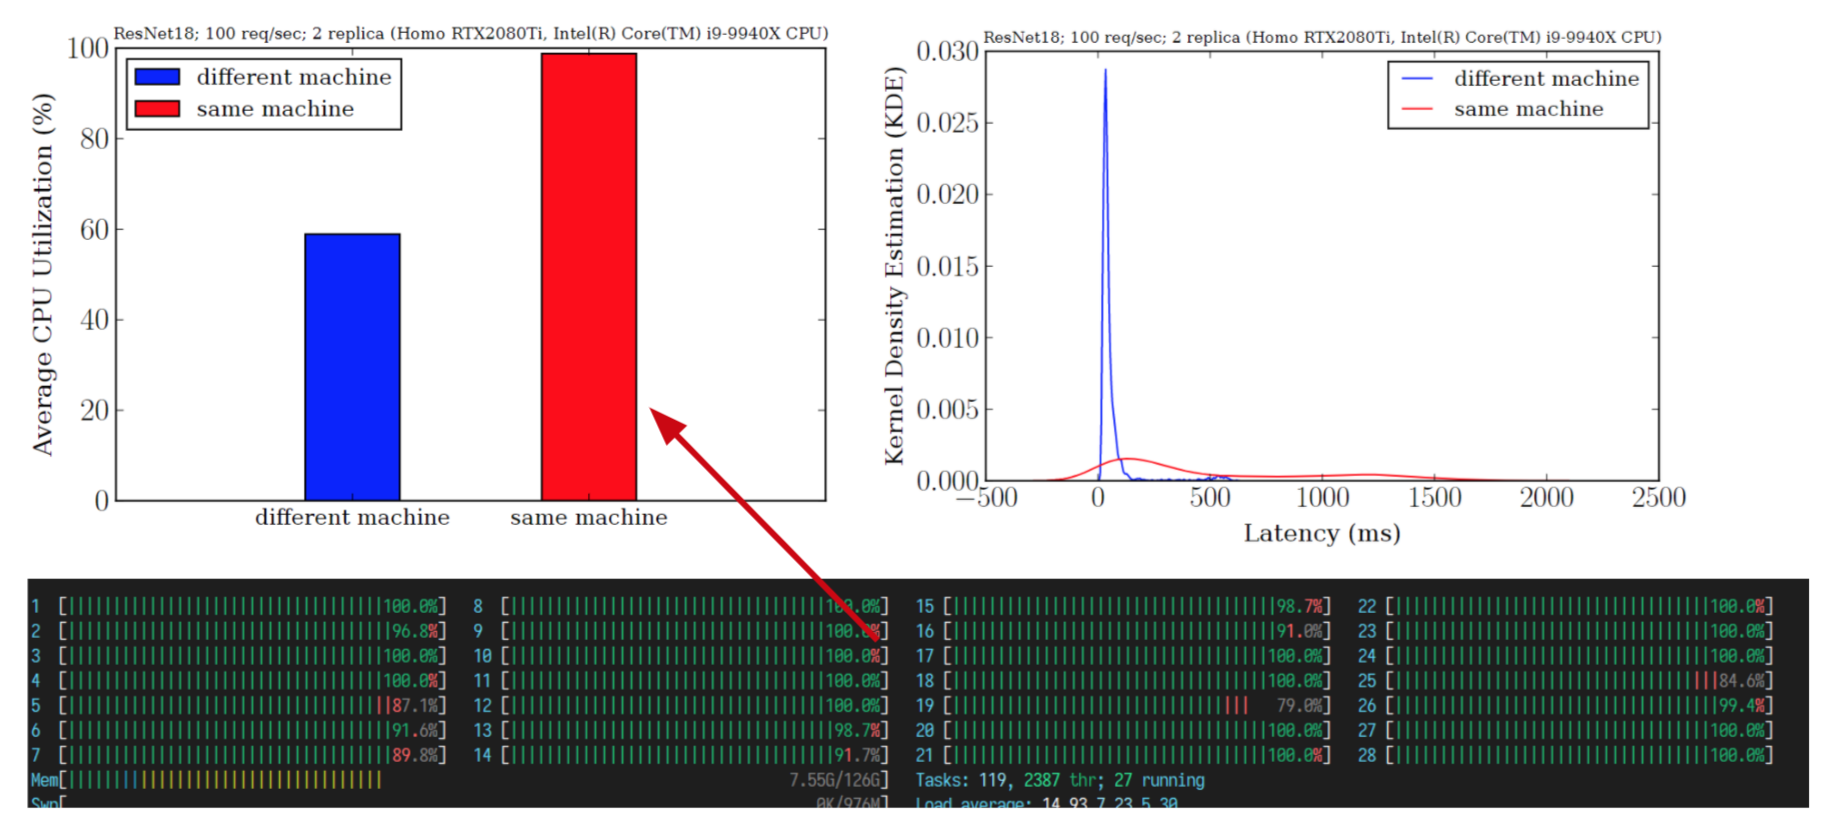
A comprehensive serving system performance analysis should include the entire pipeline and analyze both theoretical data and dynamic results. For specific scenarios, it may be appropriate to abandon certain seemingly important metrics and choose the optimal online deployment strategy for different configurations. For example, for applications where the entire model inference is executed in the backend, pre-processing and post-processing operations may affect the system’s performance in concurrent inference scenarios. As shown below, for instance, inference using the same number of RTX 2080Ti GPUs shows significantly lower performance on a single machine than on different machines. Observing system resource usage reveals that the GPU is not fully utilized; instead, CPU usage is maxed out due to data pre-processing, causing a performance bottleneck. If the system is deployed on cloud services, increasing CPU resources appropriately can break this performance bottleneck.

In summary, conducting performance testing on an ML serving service requires considering various aspects and using scientific methods to examine and analyze data. In actual production environments, many software and hardware resources may not work as officially described. At such times, comprehensive system analysis and inspection can both reveal shortcuts for improving performance bottlenecks and provide insights for future research.